Grafium
Boris Zhenikhov

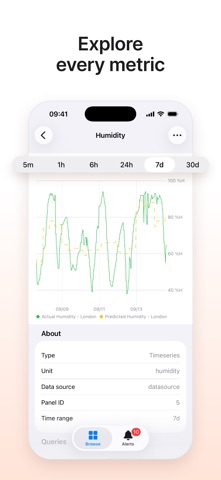
Grafium opens the dashboards and alerts from your self-hosted Grafana® on iPhone. Panels are drawn with native iOS charts, and the app only reads data: it never edits your dashboards, alert rules or server settings. • Time series, stat, gauge, bar chart, table, heatmap, logs, state timeline, geomap and other panels keep the colors, units and thresholds from the dashboard. • Change dashboard variables, pick a time range and turn on auto-refresh. • Open a panel full screen and drag across the chart to read exact values. • See firing and pending alert rules first, with their instances and labels. • Pin the dashboards you check often and search across folders. • Add several servers. Sign in with an API token, username and password, LDAP, JWT, auth proxy or SSO, or connect anonymously. Grafium has no account of its own, no tracking and no ads. Tokens and passwords stay in the iOS Keychain, and showing a saved one takes Face ID or your passcode. To look around first, tap Try Demo on the first screen. It connects to a public demo server with live dashboards and alerts. Requires Grafana 9 or later, reachable over HTTPS with a trusted certificate. Self-signed certificates are not supported. The Grafana Labs Marks are trademarks of Grafana Labs, and are used with Grafana Labs’ permission. We are not affiliated with, endorsed or sponsored by Grafana Labs or its affiliates.
Screenshots