Graphical Arterial Blood Gas
ferrazza

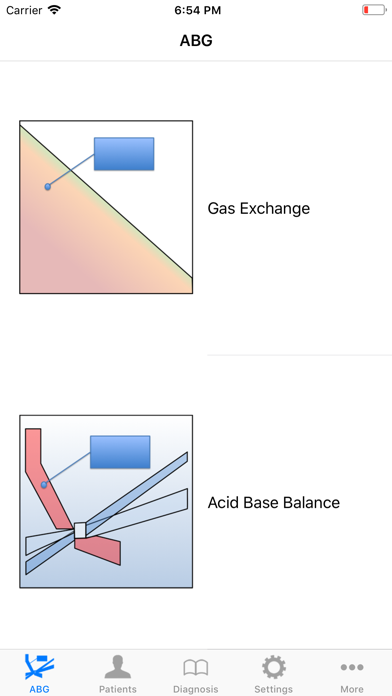
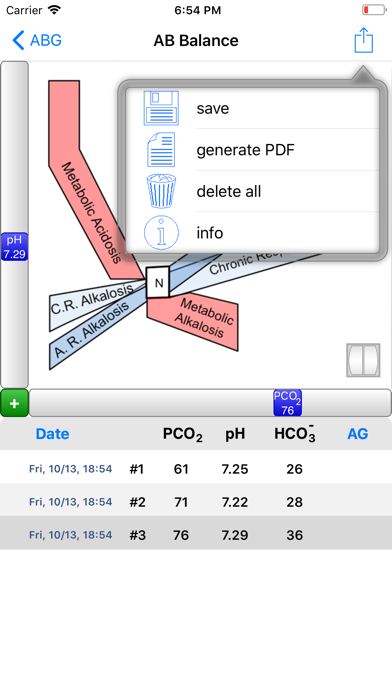
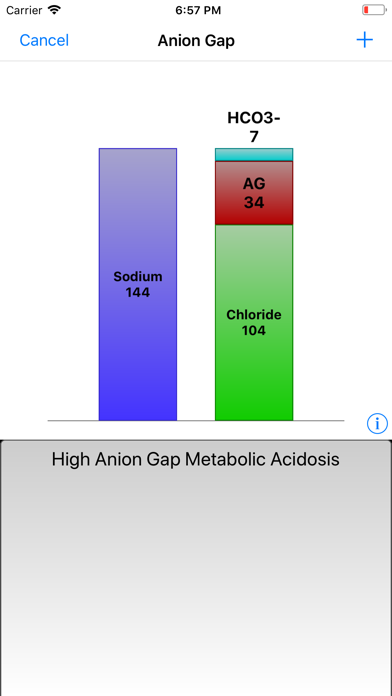
Arterial blood gases (ABG) plotting helps you to understand and evaluate patient Gas Exchange and Acid-Base status. This is possible by means of an integrated reading of arterial carbon dioxide blood pressure (PaCO2), arterial oxygen blood pressure (PaO2) and pH with two graphs: PaCO2 vs PaO2 plot and PaCO2 vs pH plot. • The PaCO2-PaO2 plot allows the assessment of the patient gas exchange status, by means of the computation of the alveolar–arterial oxygen gradient (P(A-a)O2) and P/F ratio. • The PaCO2-pH plot is based on the original Schwartz’s nomogram. It gives you immediate information on acid-base status and allows to graphically display the trend of the patients’ multiple evaluations. • For more exhaustive information on metabolic disorders, the anion gap (AG) can be calculated with an intuitive visual method. • Serial evaluations of both Gas Exchange and Acid-Base balances can be saved and are available on a table. • You can export data in pdf format and print or send via email the pdf. • A detailed diagnosis of the Acid-Base disorder is provided according to the Acid-Base balance and Sodium and Chloride values. • For each Acid-Base disorder a list of potential causes is provided. • Your personal evaluations can be saved on a patients list. • In the settings tab, you can choose the unit of measure for O2 and CO2 partial pressure (i.e., mmHg vs kPa).
Screenshots