Serial Sensor Plot
JUAN GABRIEL LOPEZ HERNANDEZ

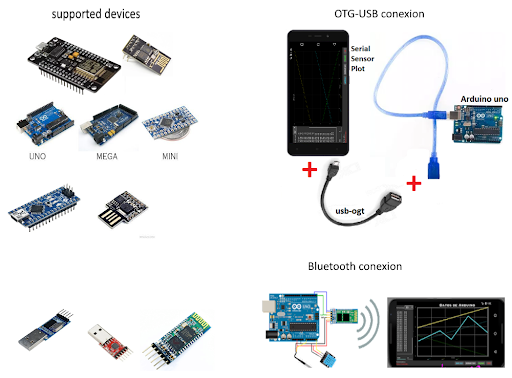
If you have an Arduino circuit or any device that sends serial data via Bluetooth, USB-OTG, or Wi-Fi and you want to view or graph it in real time and save it in Excel format, use this app.
******RECOGNIZED DEVICES*****
USB-OTG: Arduino Uno, Mega, Nano, Digyspark (Attiny85), CP210x, CH340x, PL2303, FTDI, etc.
Bluetooth: HC06, HC05, ESP32-WROM, D1 MINI PRO, etc.
WIFI: Esp8266, ESP32-WROM, etc.
*Graph up to 5 data points in real time
*Automatic stop after "n" data points
*Customizable graphs, color, variable names, etc.
*The Windows version is completely free (link to the GitHub repo below)
*Includes manual and example code for Arduino.
**** DATA GRAPH ******
The circuit sending the data must only send numeric data (never letters) separated in the following format:
"E0 E1 E2 E3 E4" Each data must be separated by a space, and there must also be a space at the end. You can send 1, 2, 3, or a maximum of 5 data points. Each data point must have a space at the end, even if it's just one data point. The delay time ( ) in Arduino must be exactly the same as the one you use in the app.
Here you can find the Arduino manual and test code:
https://github.com/johnspice/Serial-Graph-Sensor
.
******RECOGNIZED DEVICES*****
USB-OTG: Arduino Uno, Mega, Nano, Digyspark (Attiny85), CP210x, CH340x, PL2303, FTDI, etc.
Bluetooth: HC06, HC05, ESP32-WROM, D1 MINI PRO, etc.
WIFI: Esp8266, ESP32-WROM, etc.
*Graph up to 5 data points in real time
*Automatic stop after "n" data points
*Customizable graphs, color, variable names, etc.
*The Windows version is completely free (link to the GitHub repo below)
*Includes manual and example code for Arduino.
**** DATA GRAPH ******
The circuit sending the data must only send numeric data (never letters) separated in the following format:
"E0 E1 E2 E3 E4" Each data must be separated by a space, and there must also be a space at the end. You can send 1, 2, 3, or a maximum of 5 data points. Each data point must have a space at the end, even if it's just one data point. The delay time ( ) in Arduino must be exactly the same as the one you use in the app.
Here you can find the Arduino manual and test code:
https://github.com/johnspice/Serial-Graph-Sensor
.
Developer email
troyasoft1642@gmail.com
Developer website
https://github.com/johnspice/Serial-Graph-SensorReleased
Jan 6, 2018
Current version
4.3
Android version
5.1
Screenshots